04 / Finance · Platform · Automation
SnapBizIntel
Two accounting files and a time tracker, turned into one real-time P&L that ties to the books to the cent.
TITAN Business Awards
2025
Business Intelligence Solution

Summary
Snaplistings and Powered by DMT run their books in two separate QuickBooks companies and track their work in ClickUp. Nobody could answer a simple question, which clients actually make us money, without a week of spreadsheet work, and the answer was stale before it was finished. SnapBizIntel reads both accounting files and the time tracker every night, attributes every dollar and every hour to a client, and reports revenue, cost, labor, and margin per client, per category, and per month. The totals tie exactly to the accounting system's own P&L.
Context
The business is two legal entities sharing one team, and costs and people move between them constantly. A designer bills three hours to a project invoiced by one entity while the software subscription that made the work possible sits on the other entity's books. Four things made reporting effectively impossible: two accounting files for one business, class IDs that collided across the two files so identical numbers meant different clients, payroll that appeared as a lump sum with nothing connecting an hour of work to the client who received it, and a nightly sync that tried to pull twenty-one months of reports in one request and silently timed out halfway through, every night.
What I built
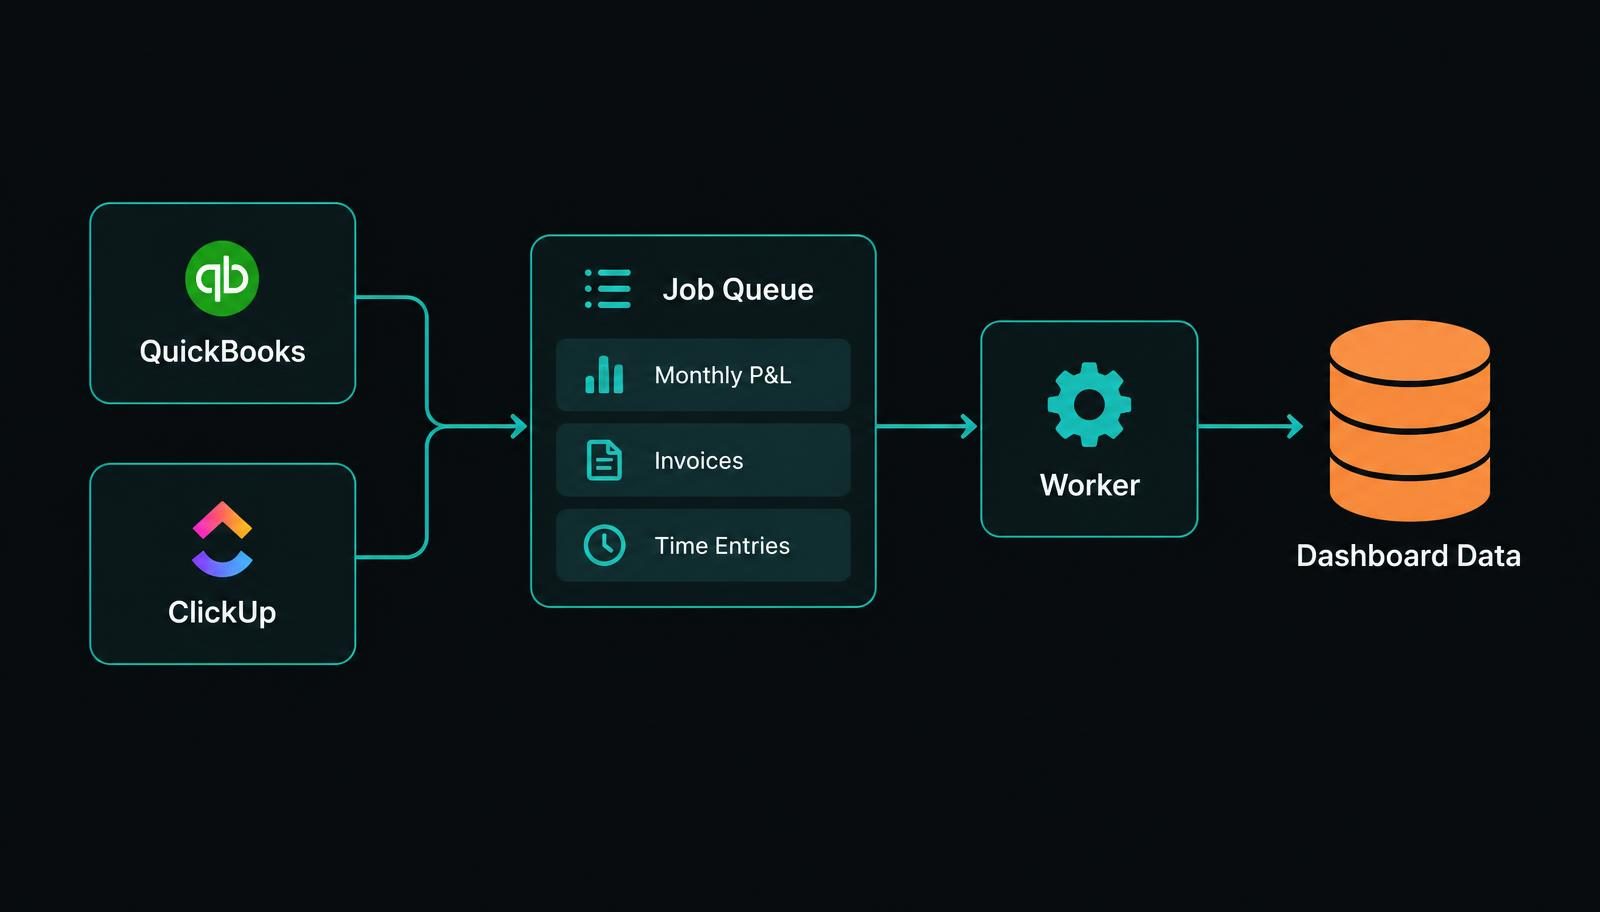
- A resumable sync queue. A planner enqueues about forty-six small jobs per entity, one per month per report plus discrete jobs for invoices, media budgets, and the class catalog. A worker claims a bounded batch, works until its time budget expires, records its position, and hands off to the next run
- Atomic job claiming with row-level locking so two concurrent runs never duplicate work, deterministic priority so the class catalog lands before any month can attribute to it, resume cursors so an interrupted job restarts where it stopped, and a loop guard that fails loudly after repeated no-progress retries
- Parse before delete: existing data is only replaced once the new data has parsed successfully
- A reconciliation panel on the dashboard showing the accounting control total, the allocated total, and the unallocated remainder, visible rather than hidden
- Labor attribution from the time tracker: a single billability policy in one function, client attribution by list mapping then explicit task-name prefixes with every fallback match logged, and honest labeling that splits unassigned into internal and unmatched
- A rate-card engine that converts hours to labor cost per client, which is what made per-client margin a real number instead of an estimate
- Atomic mapping writes inside one database transaction with a conflict panel for historical drift, a paste-in parser for the monthly offshore staffing invoice that previews before it writes, and role-based access for admin, account manager, viewer, and team member
Screens
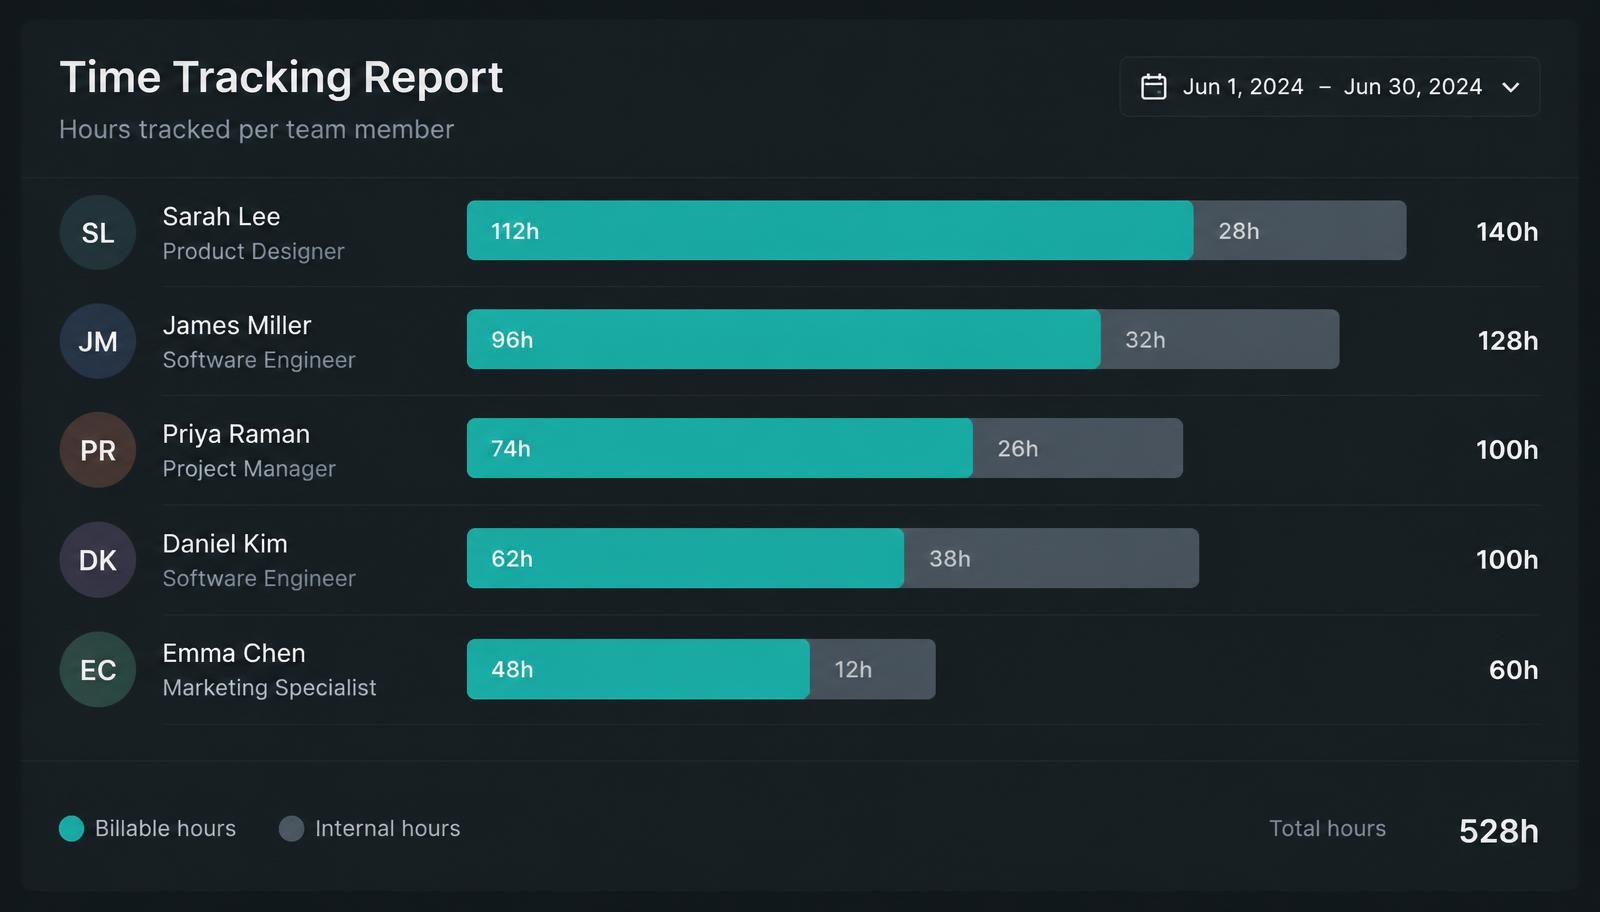
Interface visuals use representative sample data.
How it works
01
Sources
Two QuickBooks companies, ClickUp time entries, and a few Google Sheets. Different IDs, different shapes, one business.
02
Planner
Every night the planner writes about forty-six small jobs per entity: one per month per report, plus invoices, media budgets, and the class catalog.
03
Worker
A worker claims a batch under a row lock, runs until its time budget expires, records a cursor, and hands off. Interrupted work resumes where it stopped.
04
Attribute
Every dollar and every hour is mapped to a client. Fallback matches are logged. Internal work is labeled internal, not lost in unassigned.
05
Reconcile
The allocated total is checked against the accounting control total. Any remainder is shown, traced, and named.
06
Dashboard
Revenue, cost, labor, and margin per client, per category, and per month. The number at the top matches what the accountant sees.
Detail
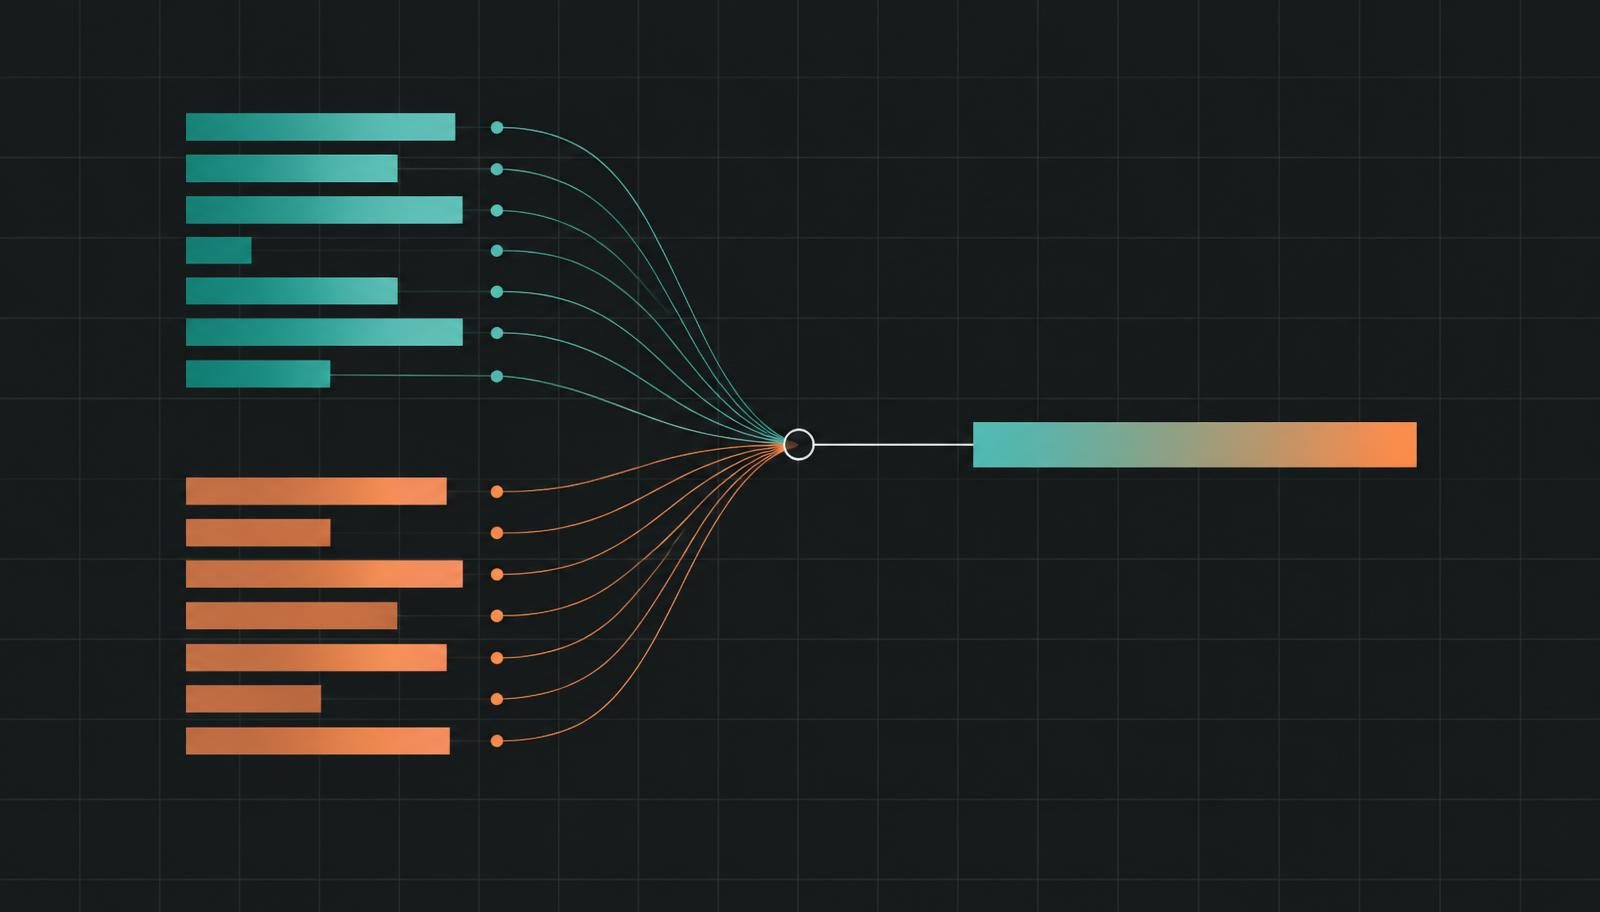
Two populations beat one
The hardest bugs were the quiet ones: figures that looked plausible and were wrong. A section-total parser dropping the parent amount on any account with sub-accounts. An absolute-value call flipping inter-entity credits into charges and inflating allocated cost by six figures. Reclassified transactions leaving their old rows behind forever. Two companies' class IDs colliding so one client quietly absorbed another's revenue. Every one of them was found the same way: derive the same number two independent ways and refuse to accept a difference. Build the second derivation on purpose.
Outcome
Both entities drain their full job queue in about four minutes with zero failures, and months that had never imported since launch came through on the first run. Fixing the time sync, which had returned only the requesting user's hours for months, recovered four months of history the business had no record of. Nine-month totals reconcile within a fraction of a percent, with each remaining variance traced to a named source. Manual reporting time dropped by 90 percent. The team opens a dashboard instead of a spreadsheet, and the number at the top of it matches what the accountant sees.
0%
Less manual reporting time
0 min
To drain the nightly queue, zero failures
0
Hours of labor history recovered
0
Small jobs per entity instead of one that never finished
My role
Product design, data architecture, and the full implementation. I also run the operation that reads the dashboard every morning.
Stack
- React
- TypeScript
- Tailwind
- Postgres
- Serverless edge functions
- QuickBooks Online API
- ClickUp API
- Google Sheets